Going with the Flow: Cash Flow Planning to Manage Financial Risk
By Stephen Miller
Senior Product manager — 5sight
FORECAST5 analytics, inc.
David Torres
Senior Product manager — 5cast
FORECAST5 analytics, inc.
The creation of flexible, unique learning environments seems to be on every school administrator’s radar. It sounds appealing, but what exactly does this mean, and in challenging fiscal times…what could it cost? The three types of spaces that every school should consider are Extended Learning Areas (ELAs), STEM/STEAM Labs or Incubator Labs and remaking the general classroom. Each can send clear messages about the values your district wants students, teachers and even your community to share in. Remarkably, each option is
scalable and includes choices that do not require major construction budgets. Read on to explore some of the new ways that educators are thinking about learning environments and specific examples of how schools are implementing these ideas.
At its core, a cash flow allows for the maximization of interest dollars and identification of borrowing needs, but truly it is much more than that; it is a risk management plan for your school district’s finances. ISO (International Organization for Standardization) 31,000 defines risk management as “the effect of uncertainty on objectives.” You protect your district from certain uncertainties by procuring property, casualty and liability insurance. This insurance coverage protects the district from financial loss due to unforeseen events such as accidents and natural disasters. How do you manage school district financial risks? With a cash flow and long-term financial projections.
There are many variations on the concept of a five-step risk management plan. One that works well for discussing school finance is presented by Craig Rowe:
1) Identify Risks
2) Measure Risks
3) Examine Solutions
4) Implement a Solution
5) Monitor Results.
Measuring the Impact of COVID-19Who was prepared for a complete economic shutdown, closing of school buildings and a shift to remote learning? Were you prepared? With the exception of districts in the southeast that are used to dealing with the potentially long-term impact of hurricane destruction, few would have identified the risk of shutting down schools for weeks or months and having to pivot to remote learning. The initial financial impact of the COVID-19 shutdown may have been some increased hardware costs to equip your students for remote learning and then some savings from reduced transportation, overtime and extra duty pay. What about the long-term economic impact of COVID-19 on your district’s various revenue sources?
Having a tool that allows you to measure the impact of economic challenges and develop and model potential solutions can help manage risk and ease anxiety for you, your administrative team and school board. To best do this, you need a cash flow.
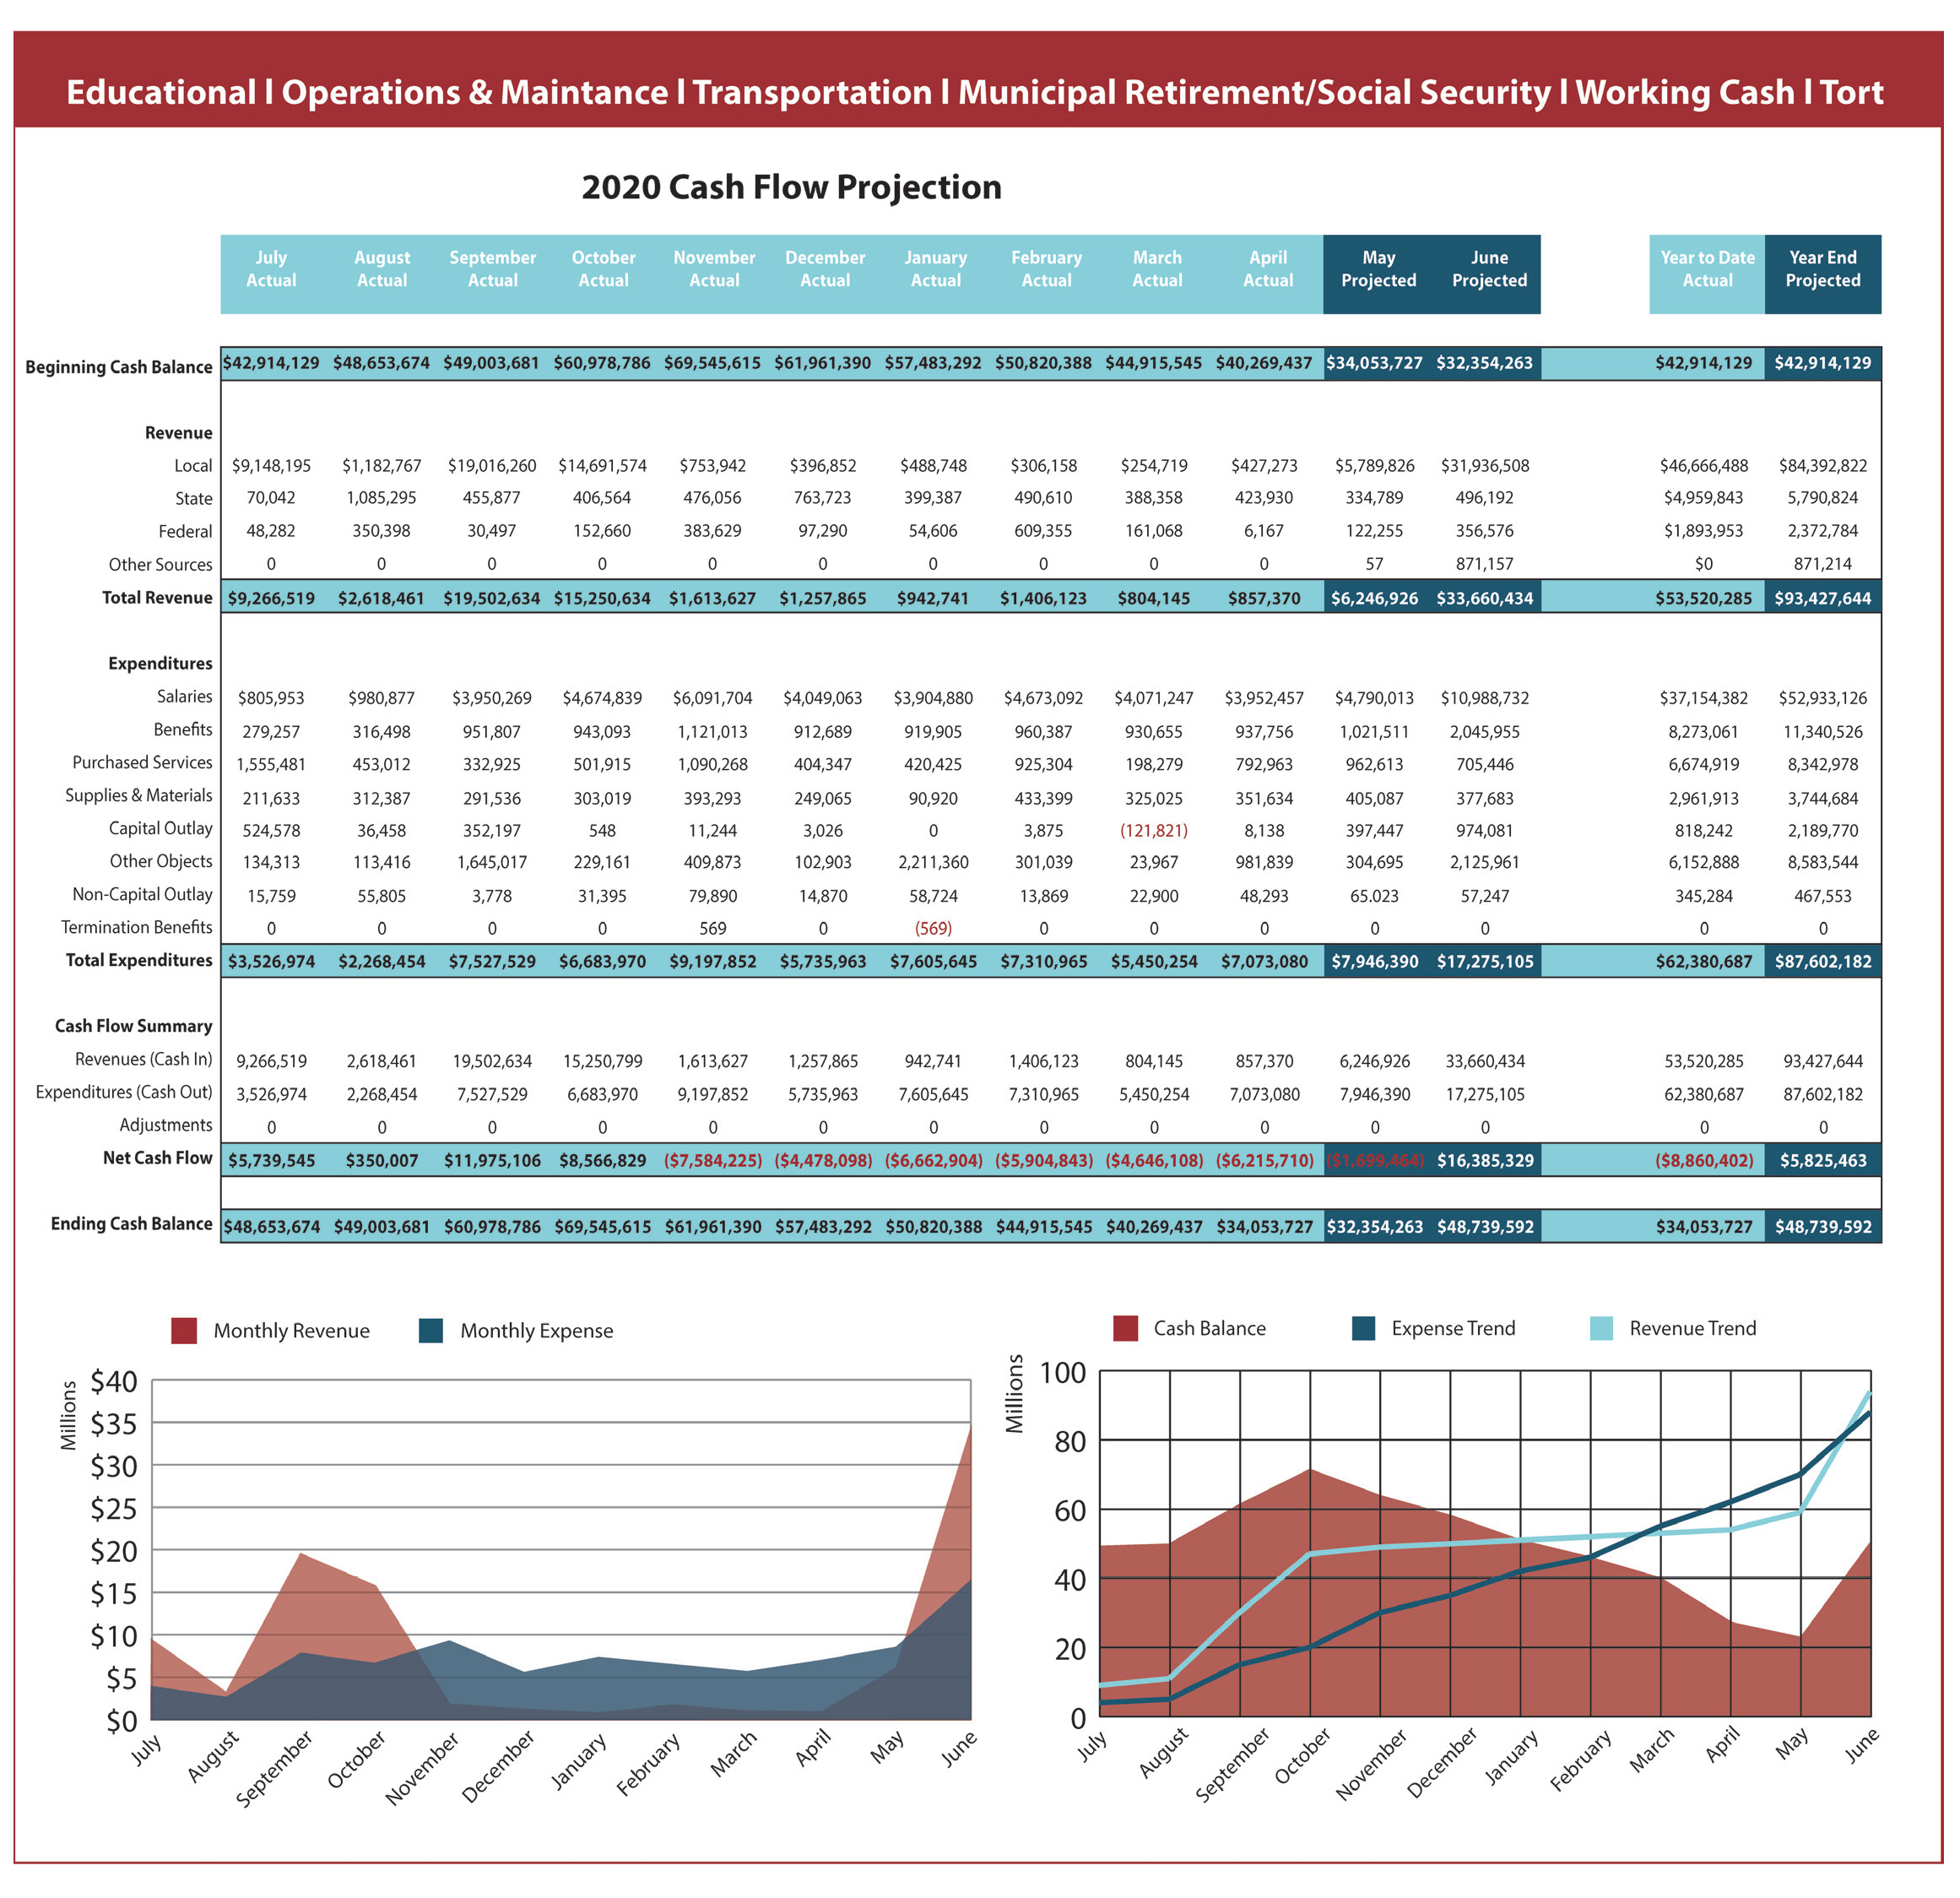
Components of a Cash FlowA cash flow needs to be adaptable and constantly monitored and adjusted, even more so in times of uncertainty. The two essential components of a cash flow, in addition to your cash balance, are inflows (revenues) and outflows (expenses). This is probably obvious, but a secondary way to group each component is as a recognized variable and/or a fixed condition. Most of a district’s revenues would fall into the variable category, because while you may have some expectation for timing and amount, they are generally outside of district control, with the state and other localities (county and/or city) controlling those processes.
Most of the expenditure side of the cash flow equation would fall into the fixed conditions bucket. Your payroll dates are set as are the majority of those costs as the fiscal year begins. Similarly, your accounts payable runs will be aligned well in advance with the establishment of your school board meeting calendar. Given the current economic uncertainty, more conditions than normal may appear variable, so it is would be worthwhile to explore a number of them in a bit more depth.
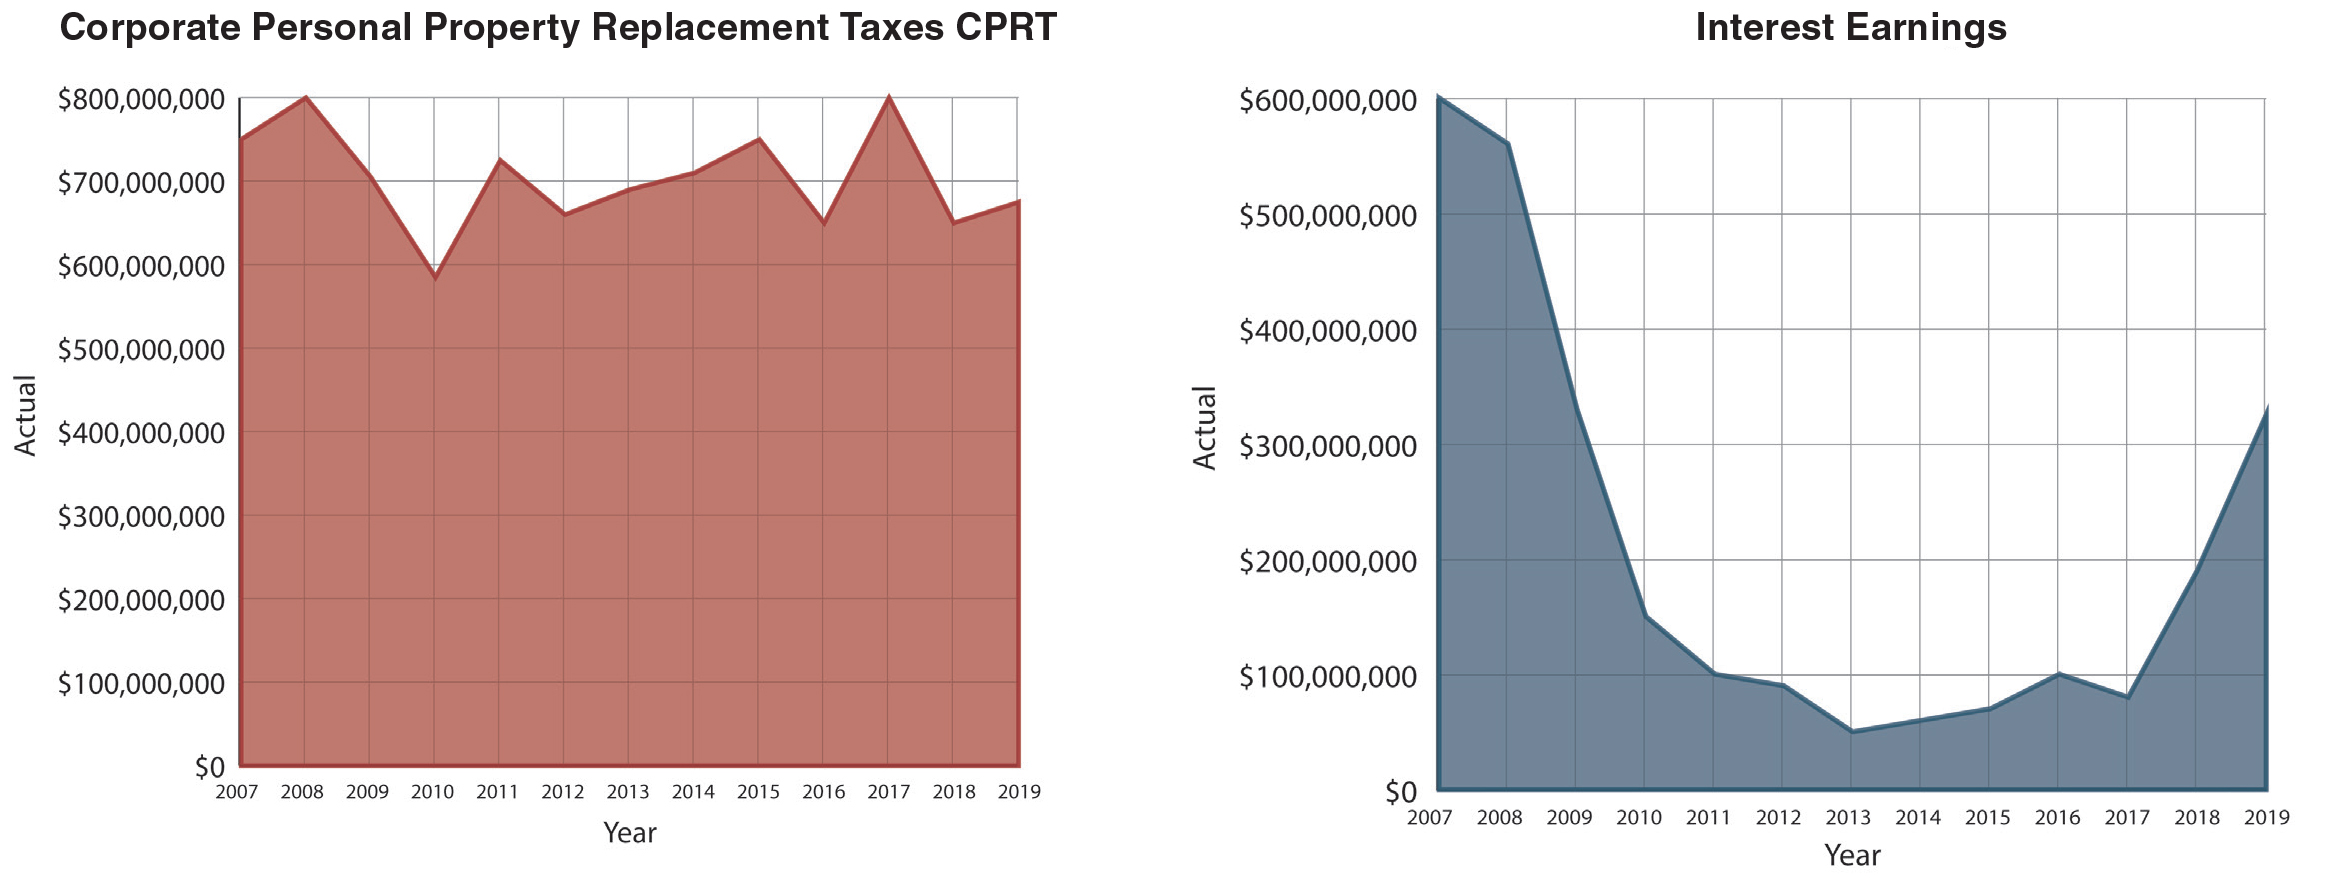
Variable ConditionsCorporate Personal Property Replacement Taxes (CPPRT)While considered a local source by the Illinois Program Accounting Manual, CPPRT is derived from state corporate income tax collections. As such, it is a revenue source that is directly impacted by larger economic forces. In fact, in the first two years of the Great Recession, we saw school district CPPRT dollars statewide drop by nearly 30 percent. It remains to be seen how long the economic impact of COVID-19 will last, but if you are a high-CPPRT revenue district, you need to model the impact of CPPRT decreases in your cash flow scenarios.
Earnings on InvestmentsInterest rates plummeted during the Great Recession, and so did school district interest earnings. The reduction was much more dramatic than that of CPPRT. In fact, for Illinois school districts it was a ten-fold drop from more than $550 million earned state-wide in FY2008 to $50 million in FY2013. In recent years, rates had climbed, and districts were again taking advantage of a good cash flow plan and extending out investment maturities to maximize higher rates until the first rate cuts at the end of 2019. Then with the attempts to bolster the economy against COVID-19, further rate cuts have the Fed funds rate again near zero. Low interest rates are not an excuse to not maintain a cash flow. Regardless of your interest earnings, your cash flow is part of a necessary financial risk management plan.
Property Tax BillingOne significant difference between the Great Recession and the economic shutdown caused by COVID-19 was the speed at which greater numbers of people were impacted economically. The Great Recession came on much more slowly, and while it did ultimately have impacts on property tax revenues for school districts, it did not ever change the timing of billings at the county level. In 2020, we quickly saw a recognition of the challenges many taxpayers would have making spring/summer tax payments and many counties waived late fees and/or delayed payment dates. In fact, the legislature in its brief special session passed SB685, allowing for delays of up to 120 days for the mailing of tax bills.
Property Tax CollectionsDo you know your typical property tax collection rate? If not, it is time to build yourself a spreadsheet. Even if you haven’t typically had issues with uncollected taxes or prior year appeals and PTAB refunds coming out of current collections, knowing your collection rate and how much it fluctuates will be critical to modeling the potential impact of an extended economic downturn. Depending on your county’s tax remittances, hopefully you can easily build an analysis to split out each distribution into separate tax years and compare the running totals to the extensions to compute running collection rates. Even in good economic times, having this process will be helpful in monitoring how collections are trending at any given point in the fiscal year in relation to past history.
Different property types bring up different considerations, so knowing the makeup of your tax base is also critical. Residential taxes are often paid from escrow accounts. Even if a homeowner becomes delinquent on their mortgage payments, the bank is responsible for paying the property taxes. Therefore, you may not see a significant drop in residential collections. Of greater concern may be collections (and in the future, appeals and PTAB filings) from commercial properties. There are many businesses that were unable to make it through the initial COVID-19 shelter in place, let alone the phased reopening. Vacant storefronts and decreasing occupancy rates in strip malls, traditional malls and big box stores will be impactful on overall collections for districts with concentrations of those types of properties. Longer-term this could result in an increased tax burden on your residential taxpayers.
 State Categorical Funding
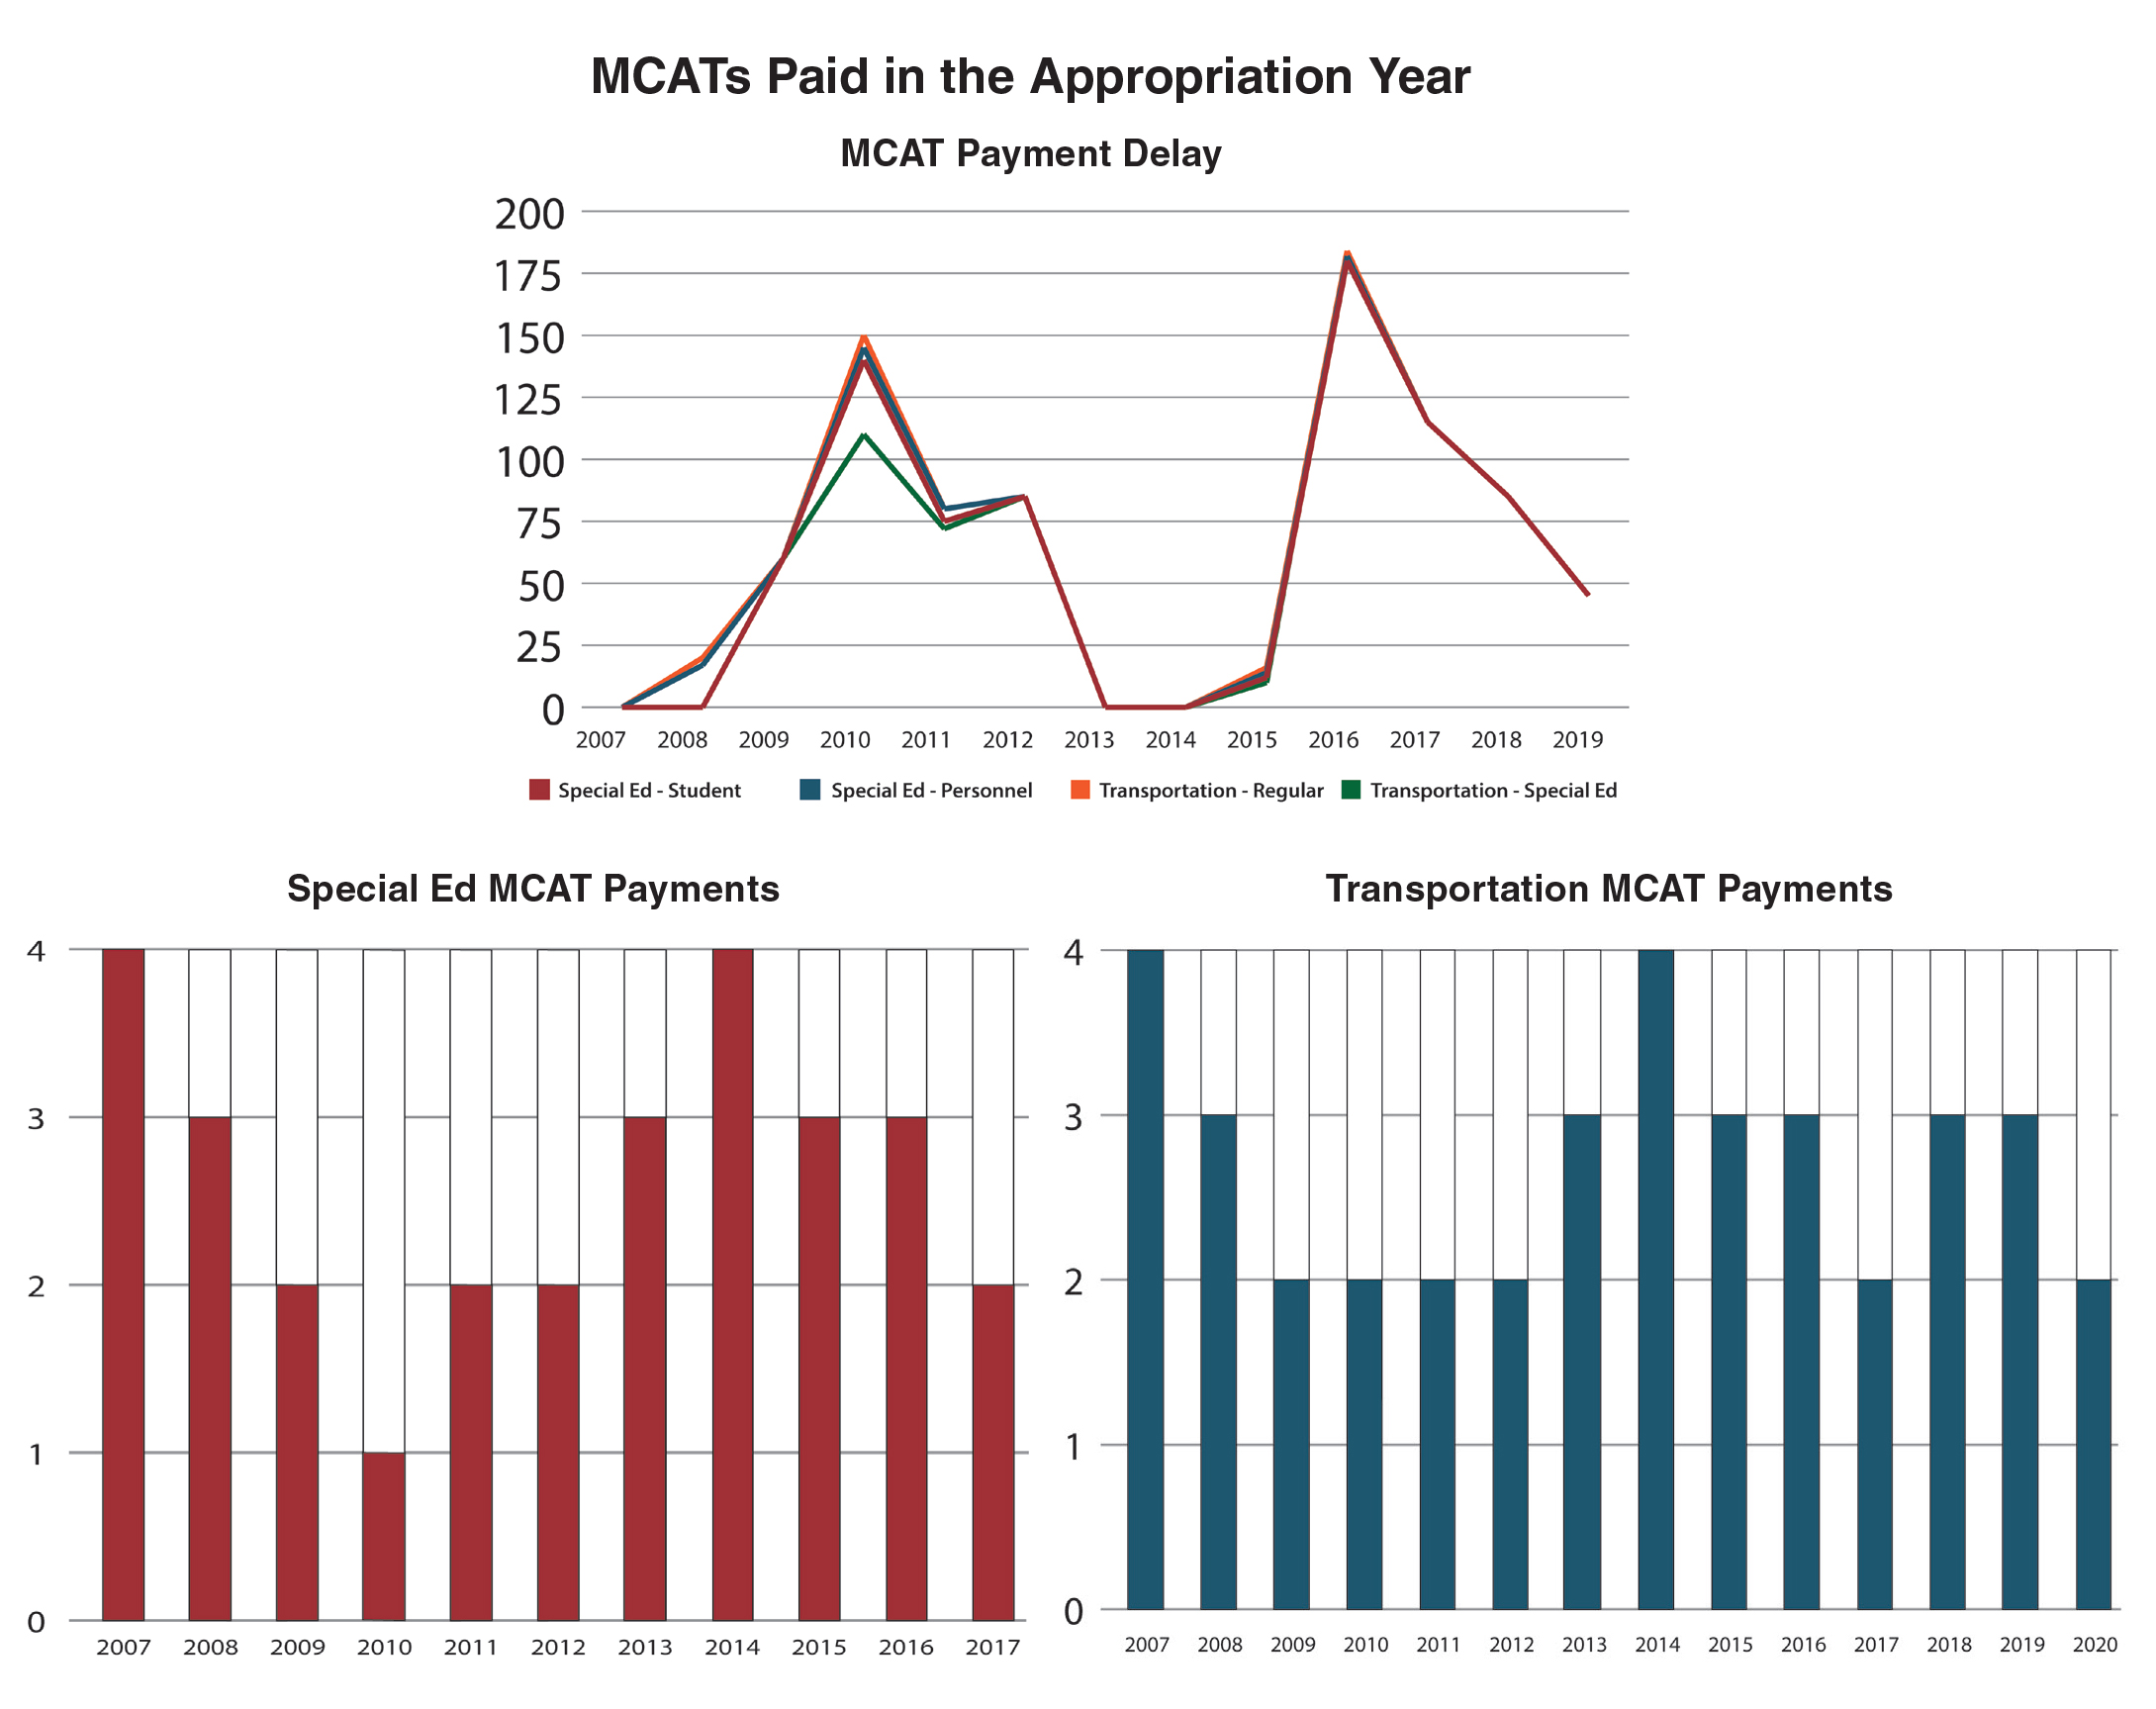
While the State of Illinois’ financial condition had improved considerably from the Great Recession and subsequently multiple years of no budget, the state still entered this economic downturn with no rainy day fund to fall back on, unlike what other states have been able to build up in recent years. This continues to put the mandated categorical (MCAT) payments at risk, as they have been perennially over the past decade or more. MCATs have still not returned to the full funding levels that districts received prior to the recession. In fact, in FY2020 Regular Transportation was only funded at 84.3 percent, Special Education Transportation at 82.8 percent and Special Education Private Facility at 79.6 percent. Increased proration of payments is certainly possible as the State continues to experience budget challenges.
Additionally, often the State has addressed its own cash flow challenges on the backs of school districts by delaying the quarterly remittances for these same less-than-fully-funded programs. Fortunately, with the implementation of Evidence-Based Funding, less funding is distributed through the MCATs, but as we saw during the recession and again during the Rauner administration’s budget stalemates, when the State faces fiscal challenges, there can be significant delays in payment. At the peak of the recession challenges in FY2010, only one of four special education MCATs and two of four transportation MCATs were paid in their proper fiscal year. ISBE had just caught up and made all payments in the proper year in FY2014 when the budget stalemates occurred. At its worst in FY2016, the final June 30 payment for all MCATs was not made until the end of December, nearly six months late.
 Variable Expenditures
While you adopt a budget as your district’s spending plan for the year, there are certain items within it that are quite variable. The weather in a given year will impact your energy usage and overtime costs for snow removal. Insurance claims or a mid-year premium renewal date can impact benefit costs. Fluctuations in energy costs will impact transportation as well as utility spending as well.
All of these variable conditions need to be reevaluated;
less frequently when economic times are more certain,
but more frequently during challenging times like the state is currently experiencing.
Fixed ConditionsA cash flow needs to account for fixed conditions as well. Questions to consider include: When are your payroll dates and how many days in advance do they need to be funded? Are they all relatively similar in amount or do you have special payrolls when extra duty is paid? What times of year are overtime costs higher? How are summer payrolls for 10-month staff handled? Once these questions are answered and your budget has been adopted, you should have a pretty good plan for how to spread payroll costs throughout the fiscal year.
The dates and amounts of debt service will be known and you should be able to lay out an accounts payable disbursement schedule based on your board meeting dates. The most variable part of expenditures will be the timing of expenditures, but if you are able to do some historical analysis, patterns will emerge.
Establishing a Cash Flow ProcessEssentially, identifying and understanding the key financial considerations, whether variable or fixed, revenue or expenditure, is an integral stage to assessing risk on your budget and assisting with financial scenarios for gauging possible adverse impacts on your instructional and operational budgets. An analysis should:
- Start with the general ledger level to set the foundation.
- Integrate both a historical perspective and the current year trend analysis for scenario comparisons.
- Include projected year-end position and reporting to support decision making.
With each month-end closing process, key financial insights can be identified and understood to provide a truer picture of your actual transactions and revenues versus what was planned for the current budget year period. Essentially, a cash flow is a financial forecast, but it requires a different level of precision and analysis that takes advantage of the treasure trove of financial data districts have from previous years, and combines it with current information, to make timely updates to the budget forecast and better predict what is needed to support the future.
 Monthly Budgets
Cash flow forecasting enables a district to create budgets for each month based on historical trends that incorporate actuals as a percentage of the total to produce a monthly average. It requires analyzing historical trends to uncover correlations between financial and operating data. For example, do revenues and expenditures tend to vary with the level of economic activity (CPI), or are they independent of business cycles? Five years of historic data is ideal to the recognition of anomalous events and patterns with exponential smoothing of trend percentages.
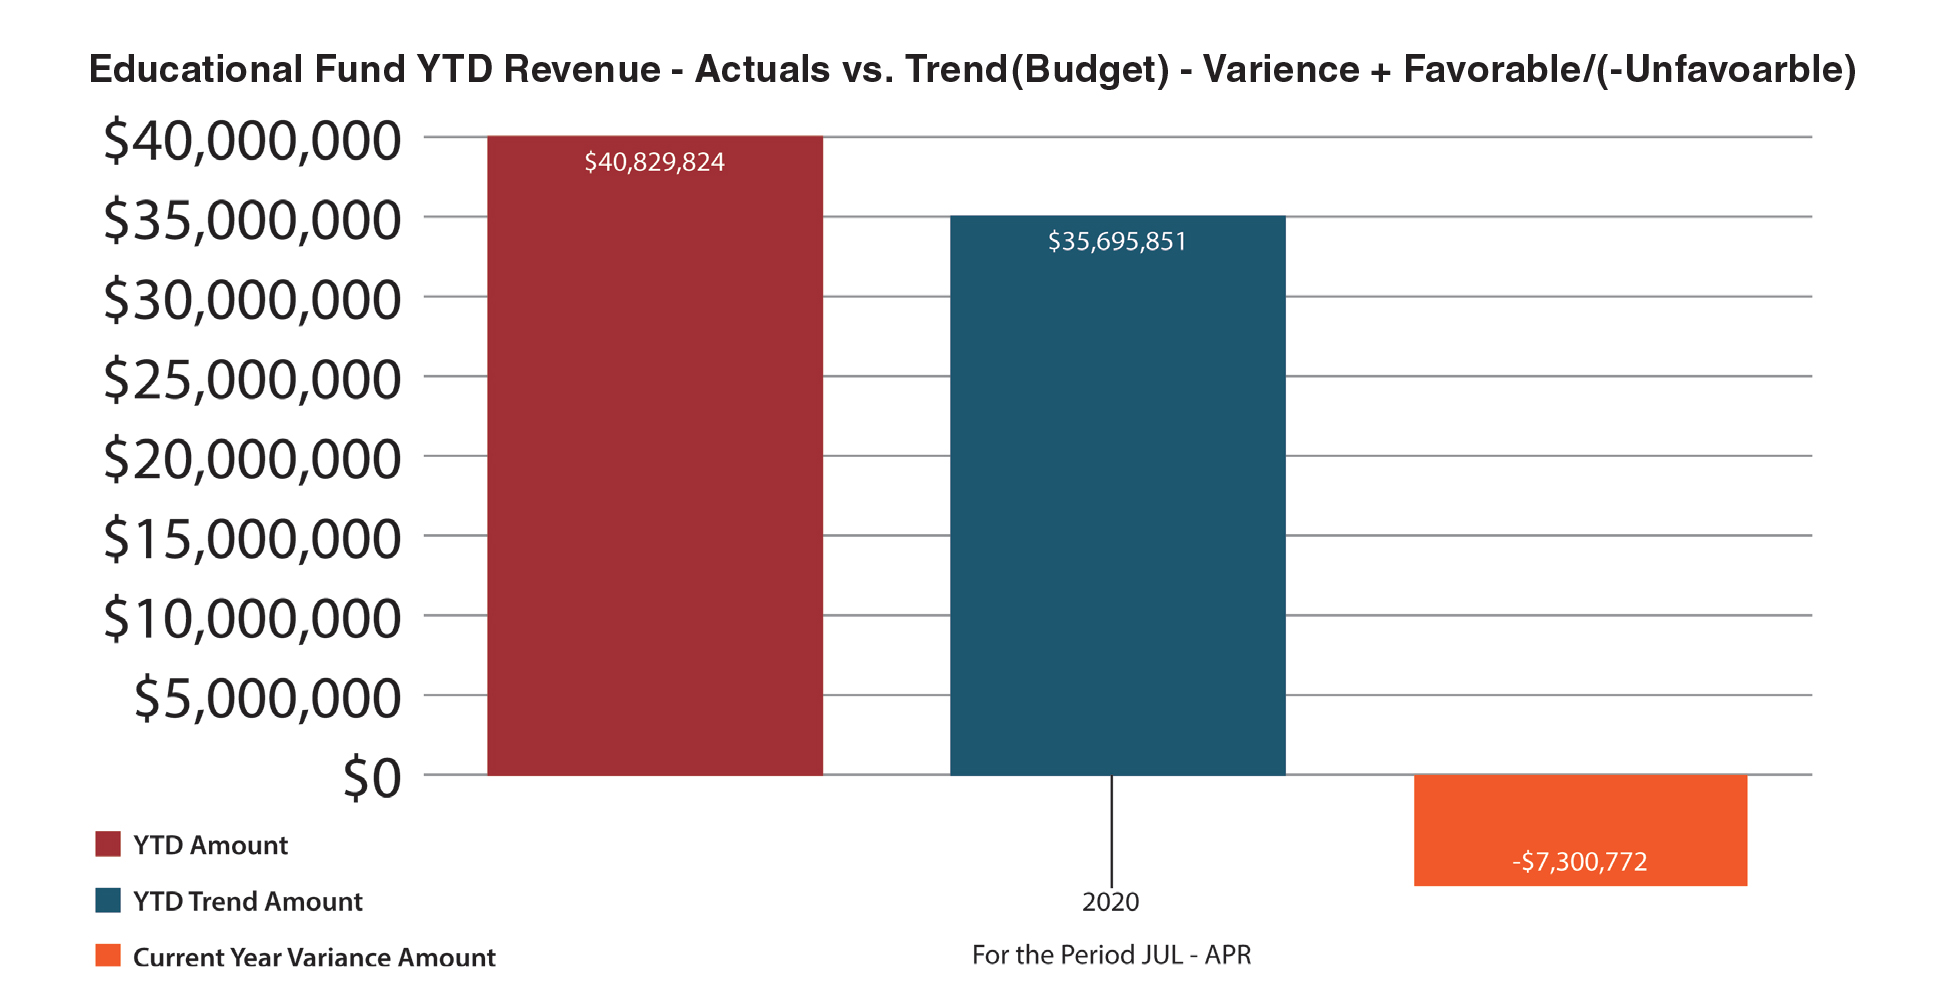
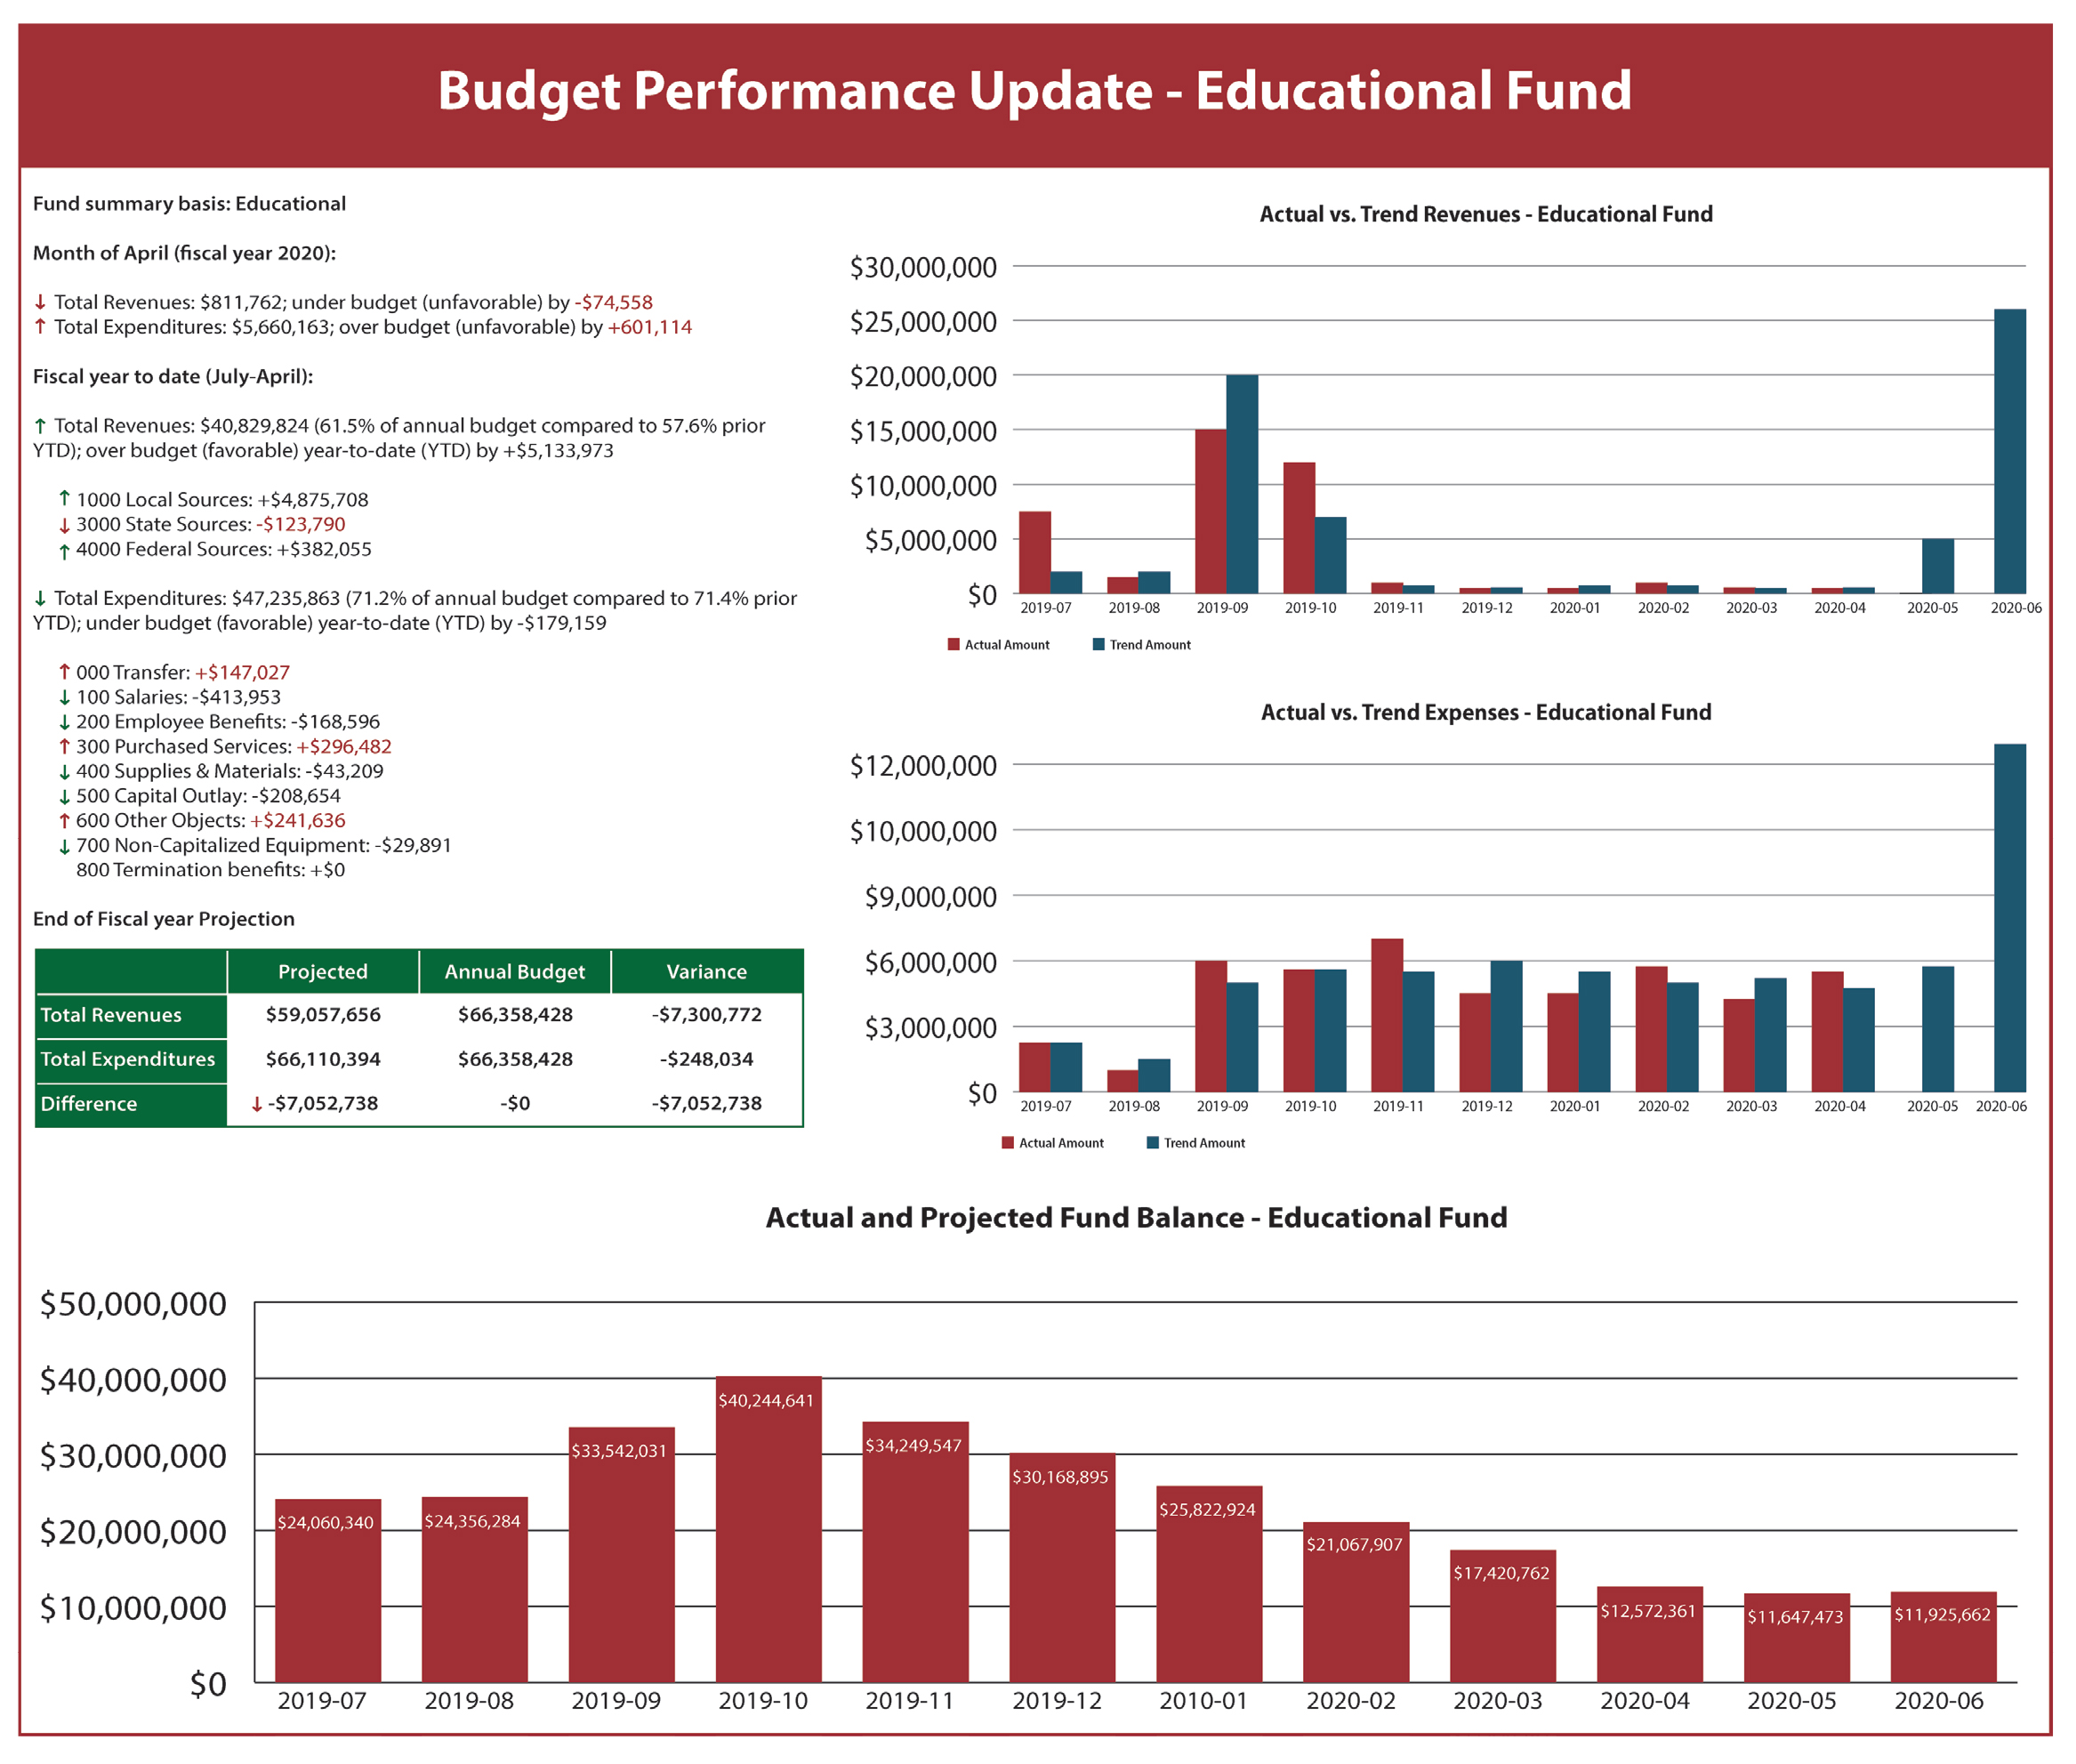
Actuals vs. BudgetsMonthly cash flow reporting shows the district’s progress in implementing the budget by evaluating the current month’s performance (MTD), the year-to-date budget (YTD) with comparisons of what was budgeted versus what actually occurred. It is also important to compare prior years’ actuals to budget and incorporate what is learned from trend analysis to make adjustments as needed to the remainder of the fiscal year.
Comparative AnalysisMonthly cash flow reporting is also an opportunity to implement a best practice of comparing current data against target goals for both MTD and YTD, as well as multi-year evaluations.
 Variance Analysis
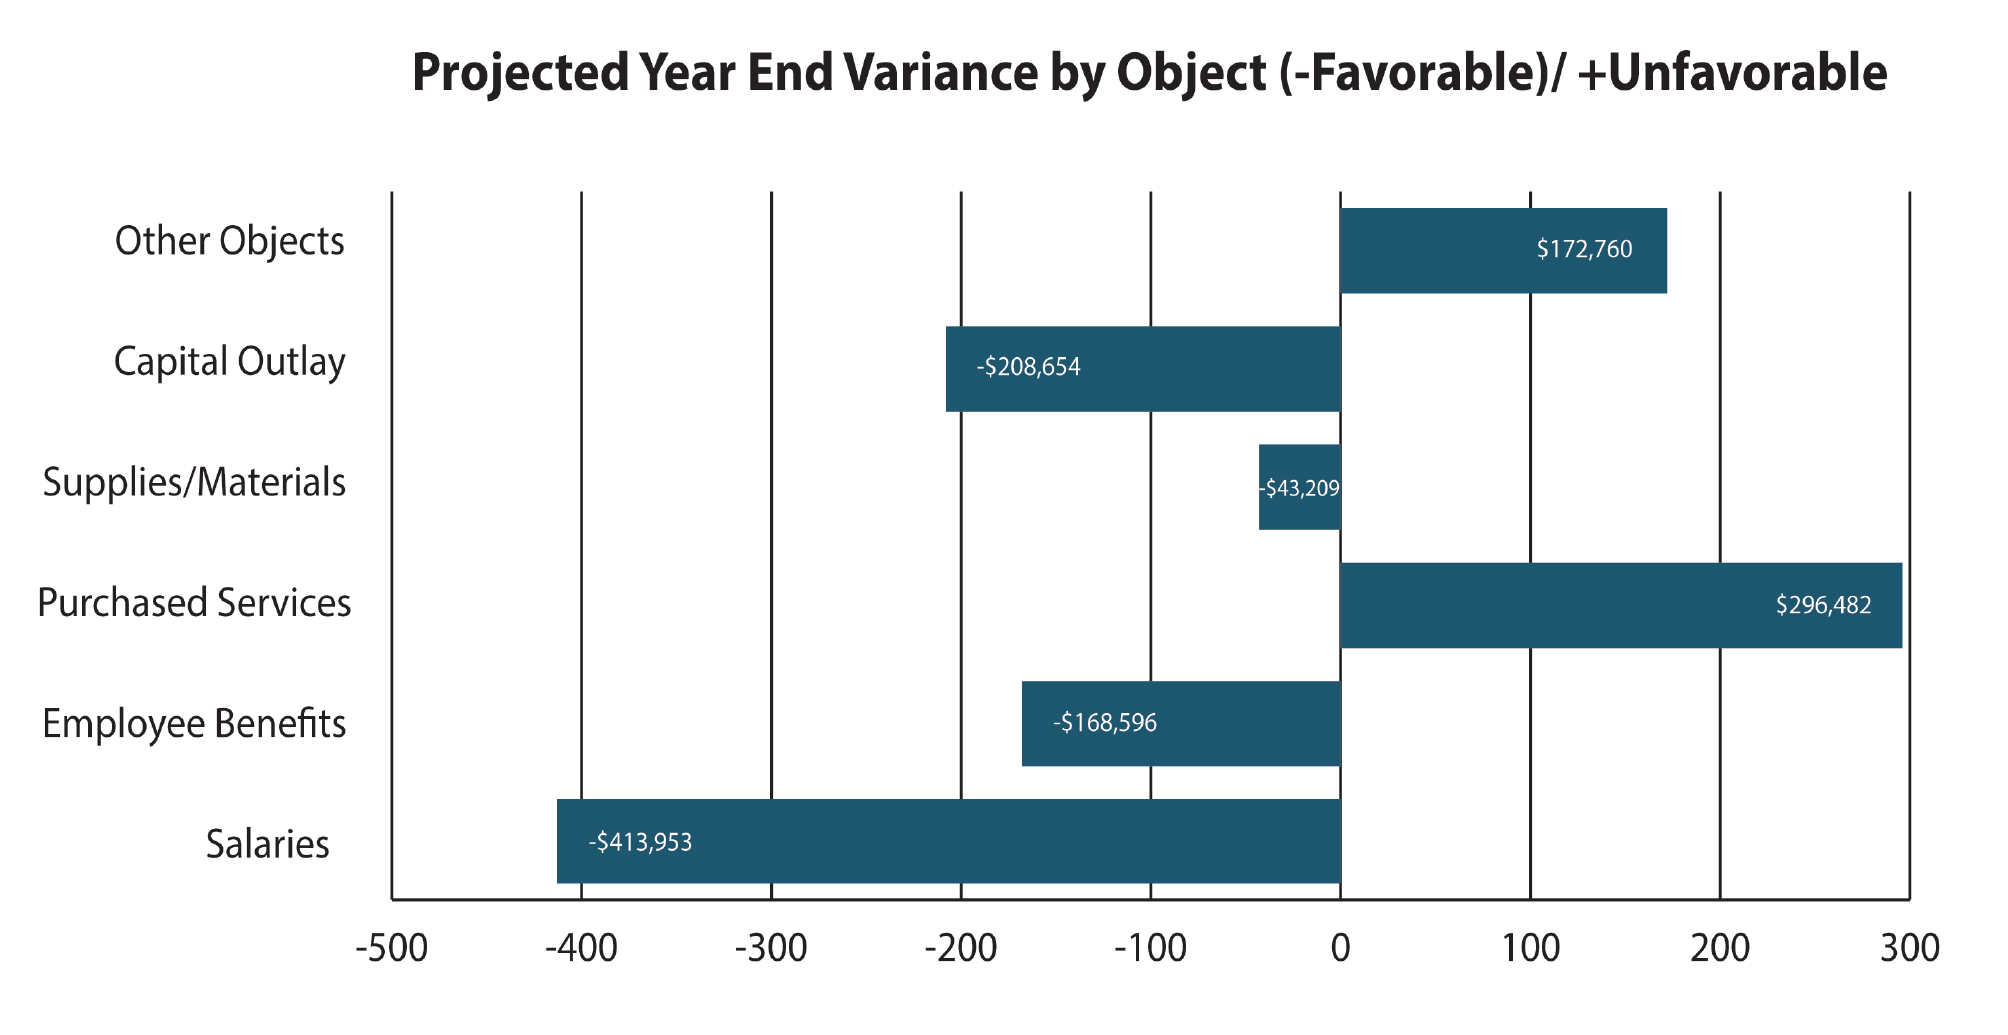
It is also critical to understand why there may be variances in the actuals versus what was planned in the budget to more accurately measure financial performance and proactively identify potential future budget variances.
Then you will be able to better reallocate current year’s funds to address the unexpected or fund priority initiatives. By maintaining control over expenses, you can create year-end estimates and anticipate projected year-end variances from the budget.
 Projected Year-End Position
By understanding the variances between planned and actual revenue/expenditures, there is an opportunity to adjust or
re-forecast targets, objectives or strategies for the current fiscal year.
The Right Tool Makes a DifferenceCash flow surveillance and forecasting requires being able to model and analyze “what if?” scenarios to identify the cause of changes, the impact of the change and what action should be taken. Traditional financial systems geared for school districts often stand in the way. They are great for recording transactions. However, to enable accurate cash flow forecasting requires analysis of current and historical data, something legacy solutions are ill-equipped to handle. Extracting insights from month-end detail can be time consuming, but necessary. Maintaining comprehensive cash flow spreadsheets is a common and practical solution. However, cash flow analysis tools are available that provide online data analysis, automated insights to variances and reporting capabilities.
An Essential Part of Risk ManagementLike any effective risk management plan, constant surveillance and monitoring for risk are necessary practices for “preparedness” planning. This same due diligence applies to your cash flow process. It may be too early to fully assess the ultimate financial consequences of COVID-19 on your district, as the situation is likely to continue evolving into 2021. Market volatility, restrictions and prolonged school related matters represent the current variable conditions facing every school leader. Establishing and maintaining a comprehensive monthly cash flow is critical for reconciling, monitoring and assessment for risk response. It will drive your essential financial decisions for budget planning and cash flow projections, with directed steps for policies and measures to support your loss-control efforts. Cash flow is a vital part of your district’s risk management plan!